Tap Water Lookup

1,252 of the 1,659 lights are between the Arabian Sea and the western Pacific.

World water map · updated Sep 27, 2026

Ocean plastic map

Where river plastic reaches the sea, how much, and who is cleaning it up.

1,659river mouths carry 80% of the plastic that rivers wash into the ocean. Each light on this map is one of them.

2015 model estimate from Meijer et al. (2021), 31,818 river outfalls worldwide.

Key numbers

979,458 tonnes

of plastic reach the ocean from rivers every year, by the 2015 model estimate.

Meijer et al. (2021) – with minor processing by Our World in Data · 2015 model estimate · CC BY 4.0 · Estimated plastic entering the ocean via rivers. Country totals exclude plastic waste exported overseas, which may be at greater risk of entering the ocean.
36%

comes from the Philippines alone: 356,371 t a year, the largest share of any country.

Meijer et al. (2021) – with minor processing by Our World in Data · 2015 model estimate · CC BY 4.0 · Estimated plastic entering the ocean via rivers. Country totals exclude plastic waste exported overseas, which may be at greater risk of entering the ocean.
#34

is the United States, with 2,431 t a year, out of 163 countries with an estimate.

Meijer et al. (2021) – with minor processing by Our World in Data · 2015 model estimate · CC BY 4.0 · Estimated plastic entering the ocean via rivers. Country totals exclude plastic waste exported overseas, which may be at greater risk of entering the ocean.
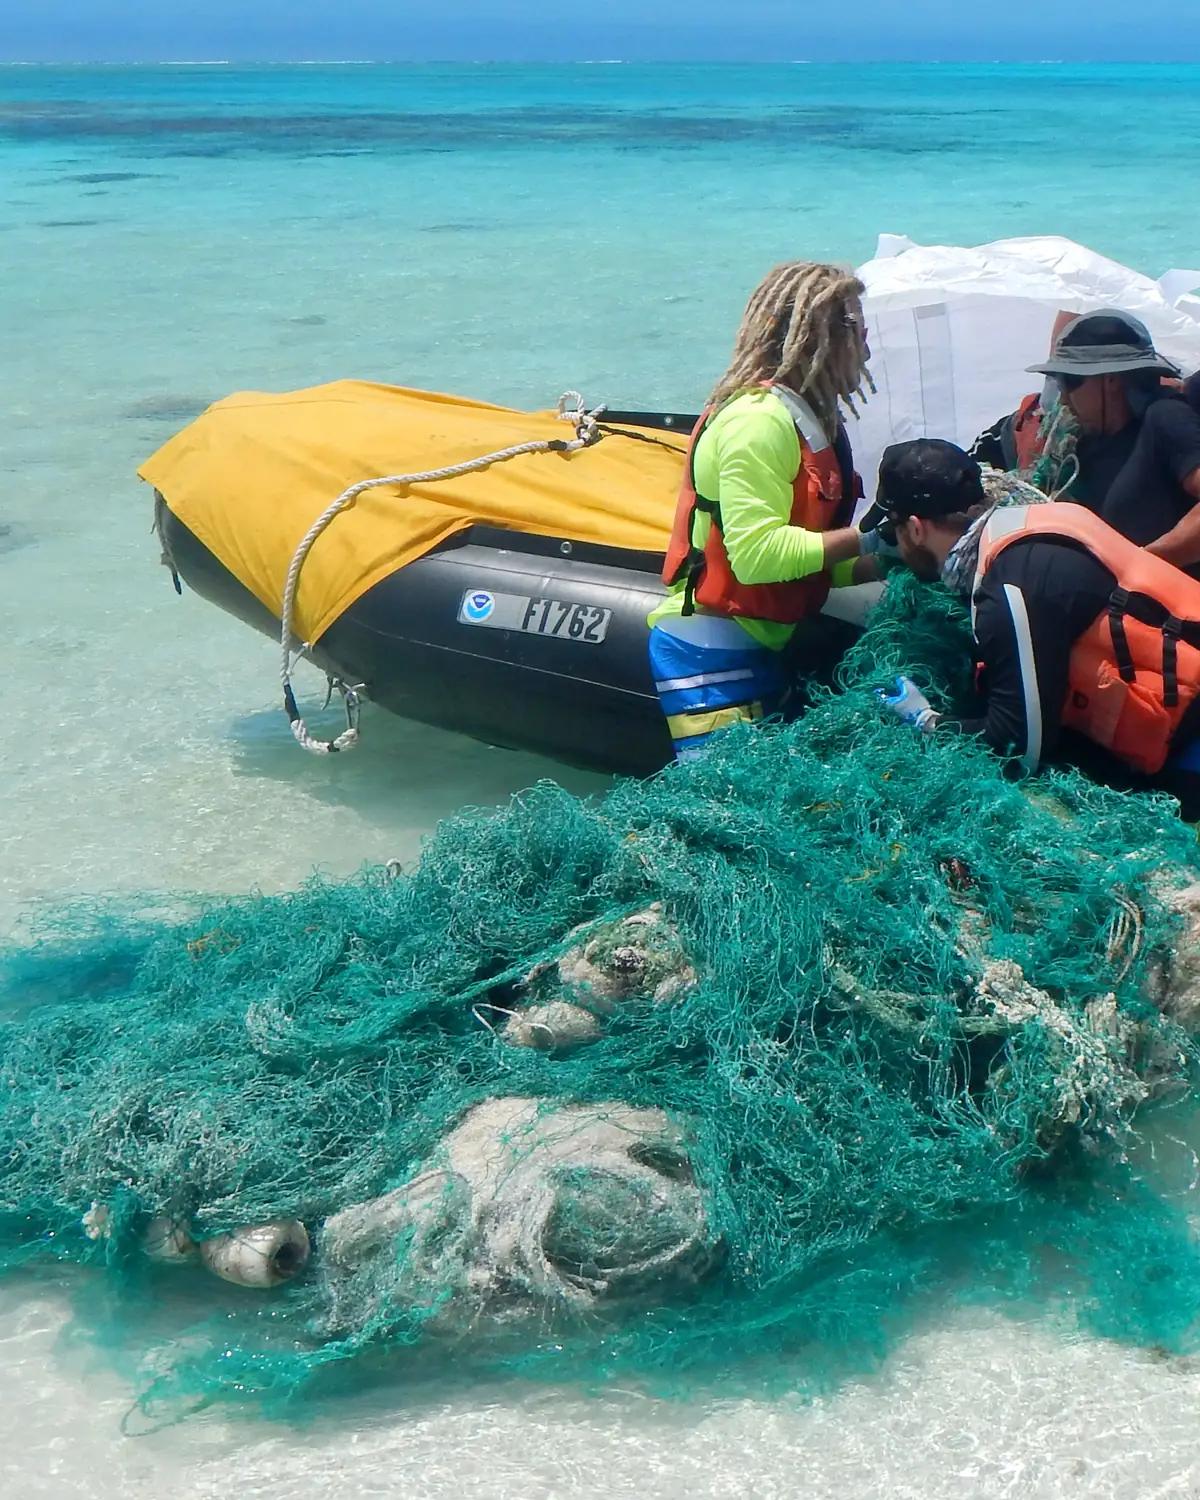
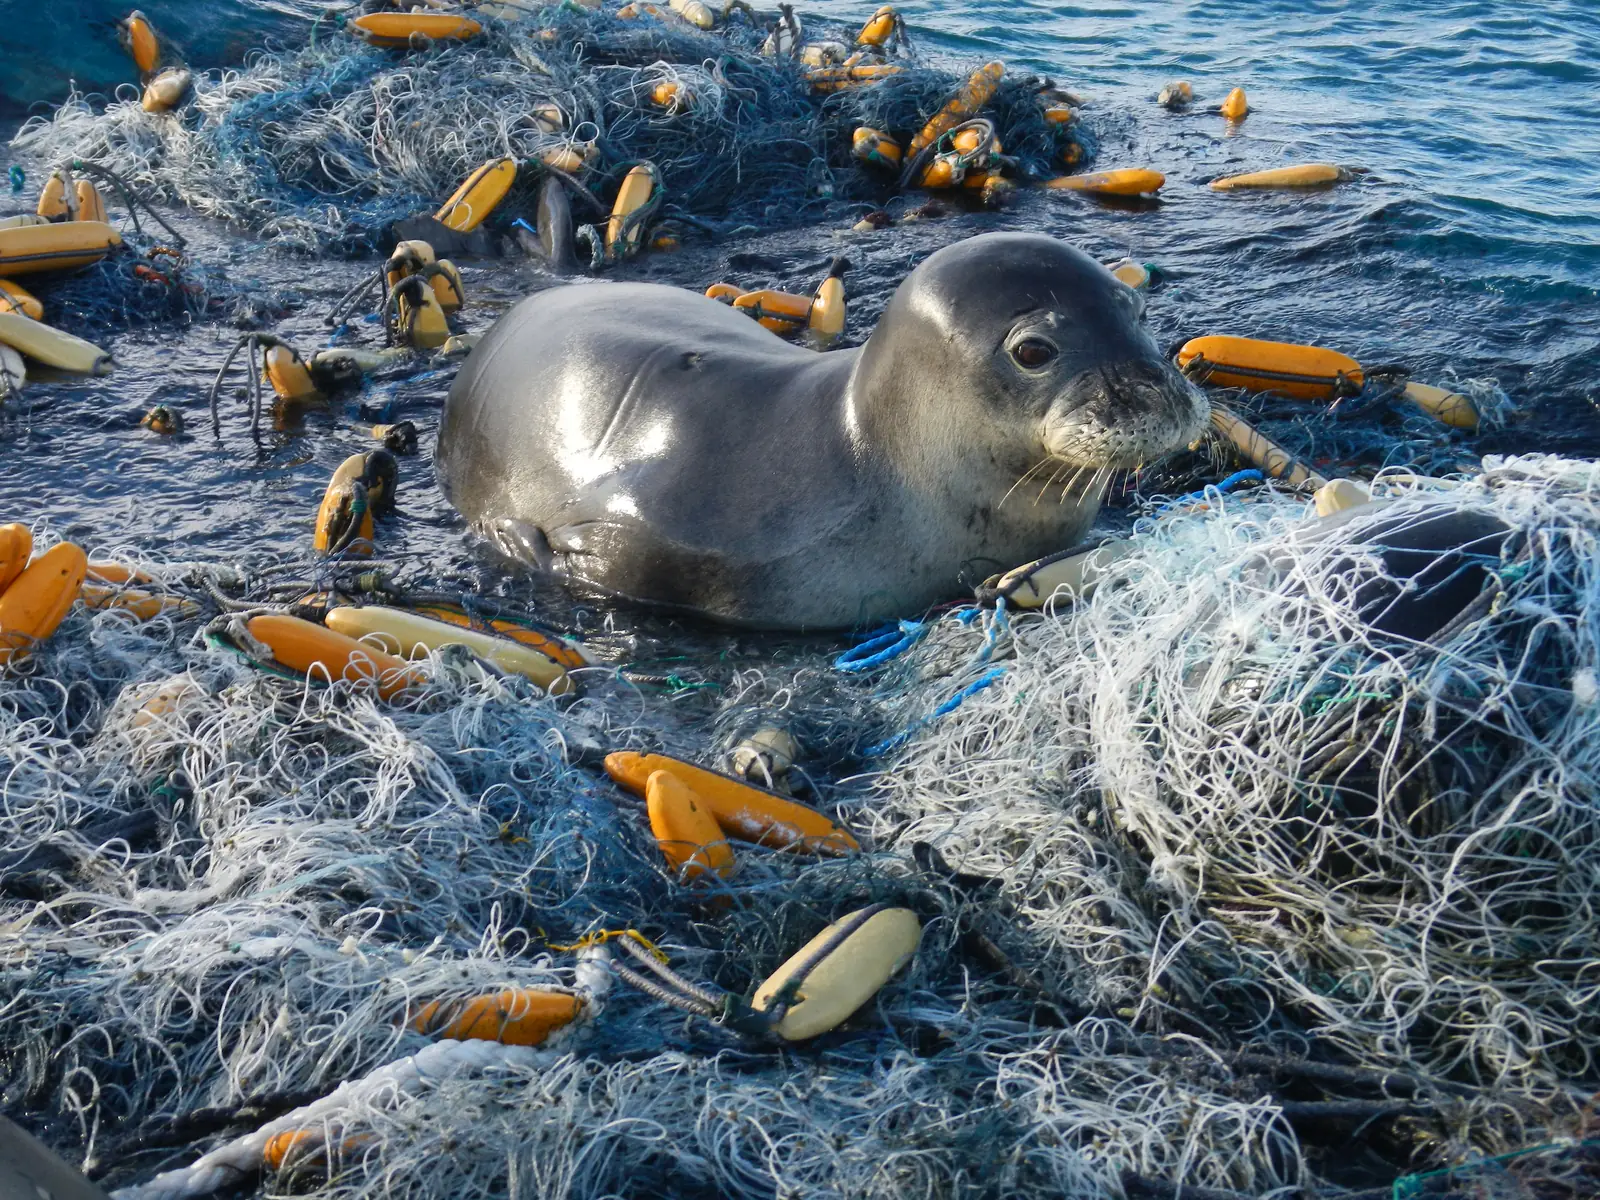
A Hawaiian monk seal resting on a floating mass of fishing nets and plastic floats

Nets like these are lost at sea. The river estimates above leave them out.

Pearl and Hermes Atoll, Northwestern Hawaiian Islands27.8° N 175.8° WA Hawaiian monk seal rests on a mass of lost fishing net.Photo: NOAA, Papahānaumokuākea Marine National Monument (public domain)

01 · Explore

Move the map. Tap a country.

Switch between plastic reaching the ocean and safe drinking water, and turn on the river mouths.

By country
Models and official assessments
World map of plastic reaching the ocean from rivers, by country

Plastic reaching the ocean from rivers, tonnes per year (2015 model)

  • Under 10 t
  • 10–100 t
  • 100–1k t
  • 1k–10k t
  • 10k–100k t
  • 100k t or more

No estimate (not clean water)

Source: Meijer et al. (2021) via Our World in Data · CC BY 4.0 · retrieved 2026-09-27

Drag to move · Ctrl or ⌘ + scroll to zoom · click a country for its numbersSwipe sideways to move · pinch or use + and − to zoom · tap a countryKeyboard: arrow keys move · + and − zoom · 0 shows the whole world · Esc closes · “Find a country” opens one

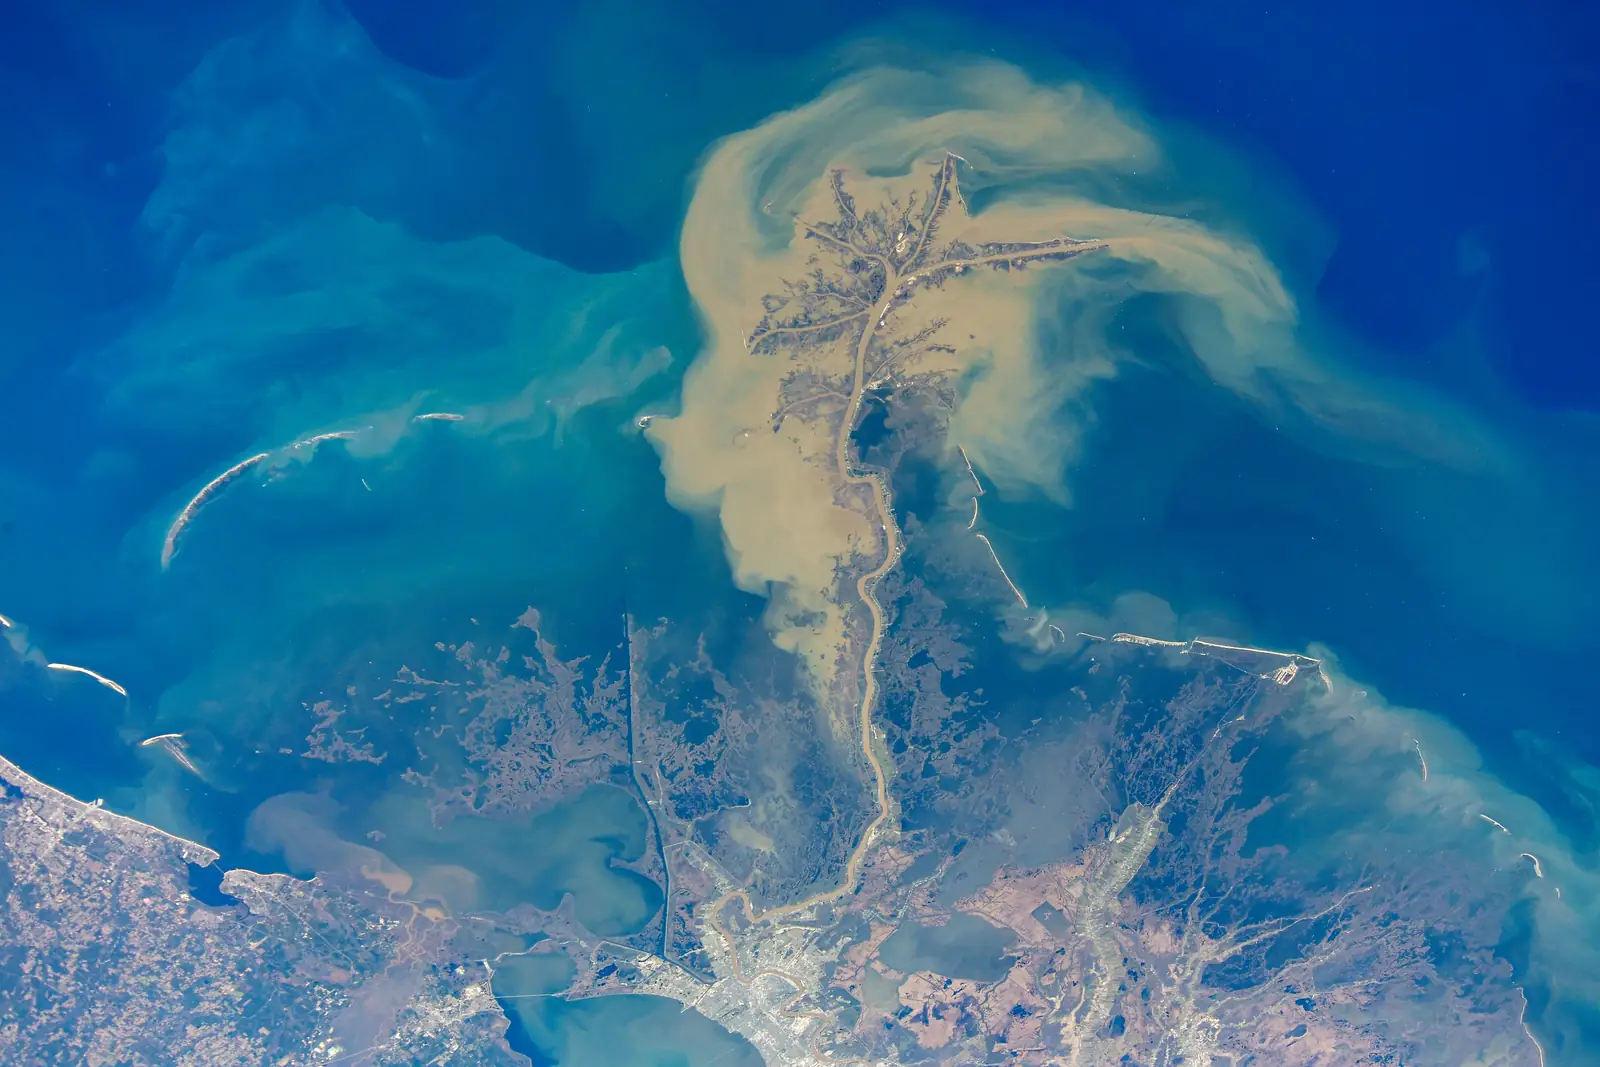
The Mississippi River delta seen from space, with brown sediment plumes spreading into the Gulf of Mexico

02 · The rivers

Small rivers. Big cities.

Mississippi River delta, Louisiana29.1° N 89.2° WSeen from the International Space Station: rivers carry what cities and farms lose to the sea.Image: Earth Science and Remote Sensing Unit, NASA Johnson Space Center (public domain)

Most plastic reaching the ocean comes from rivers that run through large coastal cities, not from the world’s longest rivers. The Pasig in Manila alone carries 6.4% of the global total, according to the model.

Together, these ten rivers carry about 15% of the modelled total (Meijer et al. 2021, 2015 model).

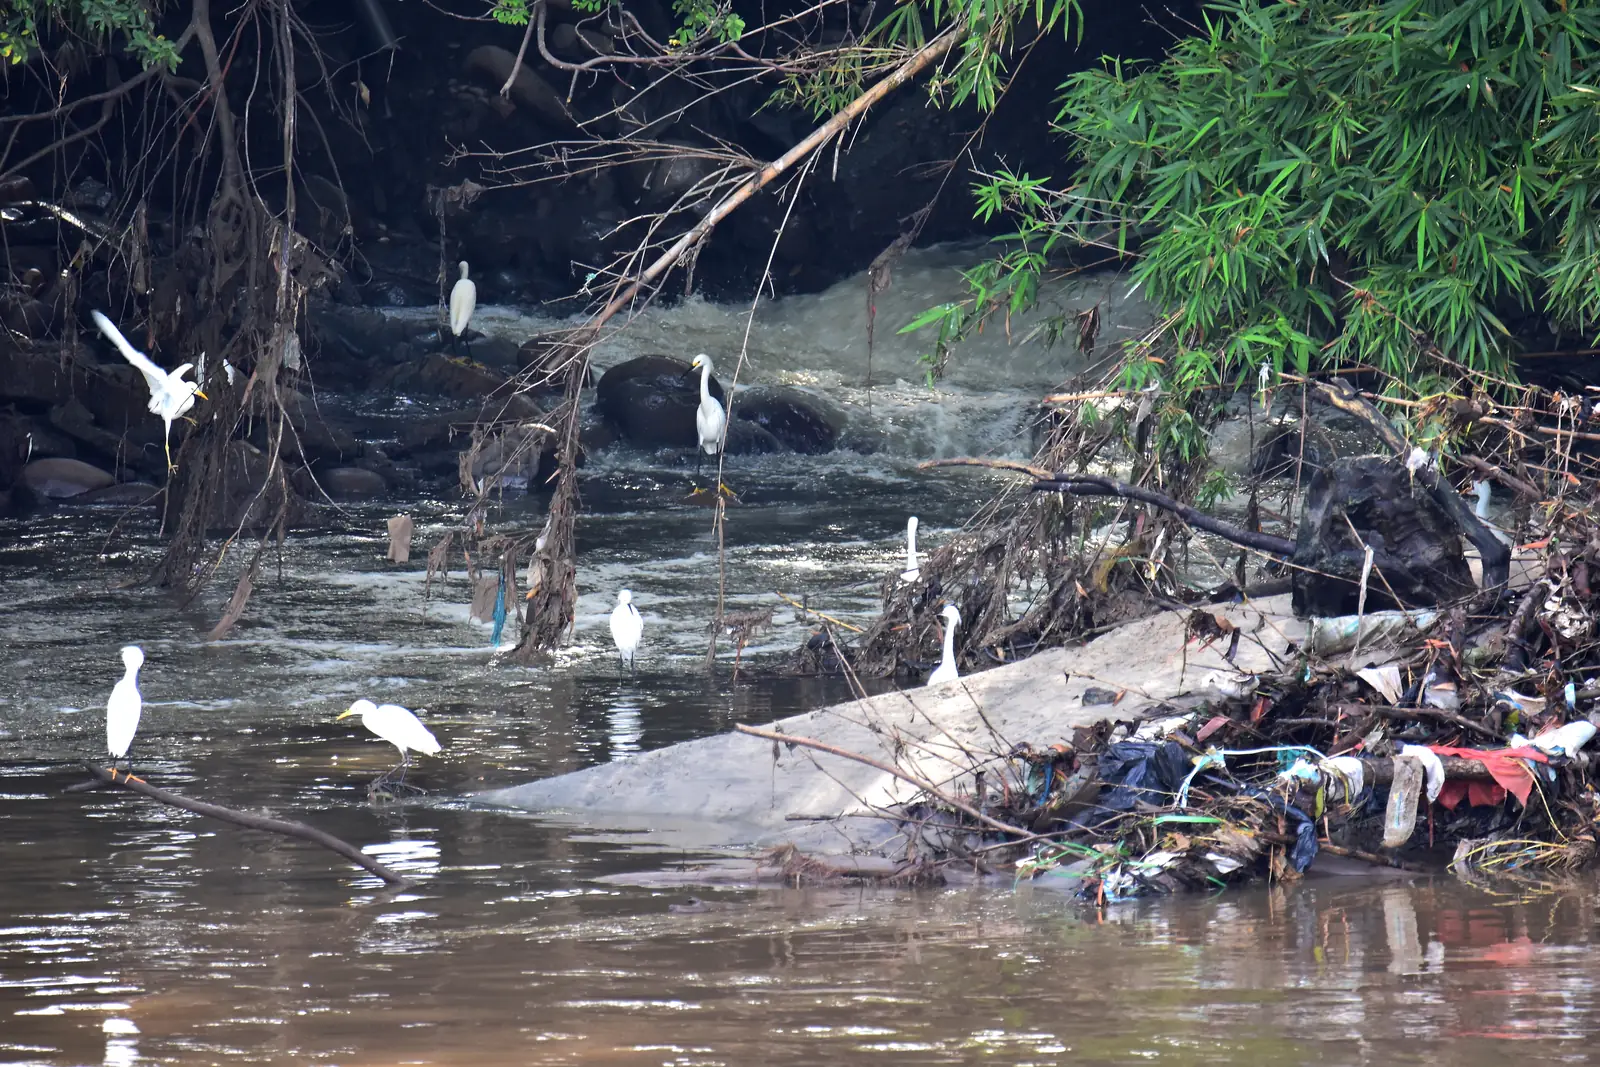
Egrets wading beside plastic bags and trash snagged on a concrete ledge in a brown river
Neiva, Colombia2.9° N 75.3° WPlastic snagged along the Magdalena River.CesarRincon, Wikimedia Commons (CC0)

% of global river plastic · model

  1. 1PasigManila, Philippines6.4%
  2. 2Klang · Malaysia1.3%
  3. 3Tullahan · Philippines1.3%
  4. 4Ulhas · India1.3%
  5. 5Meycauayan · Philippines1.2%
  6. 6Pampanga · Philippines0.9%
  7. 7Libmanan · Philippines0.7%
  8. 8Ganges · India0.6%
  9. 9Rio Grande de Mindanao · Philippines0.5%
  10. 10Agno · Philippines0.5%
All 50 rivers in the list
#RiverCountryShare of global river plastic
1PasigPhilippines6.43%
2KlangMalaysia1.33%
3TullahanPhilippines1.33%
4UlhasIndia1.33%
5MeycauayanPhilippines1.23%
6PampangaPhilippines0.95%
7LibmananPhilippines0.72%
8GangesIndia0.63%
9Rio Grande de MindanaoPhilippines0.54%
10AgnoPhilippines0.47%
11AgusanPhilippines0.47%
12ParanaquePhilippines0.45%
13IloiloPhilippines0.43%
14Soai RapVietnam0.42%
15Chao PhrayaThailand0.41%
16Lagos HarbourNigeria0.41%
17HugliIndia0.40%
18HuangpuChina0.37%
19Pazundaung CreekMyamnar0.37%
20BharathappuzhaIndia0.36%
21Ebrie Lagoon / KomoeCote d'Ivoire0.34%
22SarawakMalaysia0.34%
23Msimbazi RiverTanzania0.33%
24ImusPhilippines0.32%
25Chenzhen RiverChina0.30%
26Cilliwung—0.29%
27LangatMalaysia0.29%
28Wouri RiverCameroon0.29%
29KelaniSri Lanka0.28%
30Malad CreekIndia0.28%
31ZapotePhilippines0.28%
32Cagayan de OroPhilippines0.27%
33Davao RiverPhilippines0.27%
34KarnaphuliBangladesh0.27%
35Rio PavunaBrazil0.27%
36Kelantan RiverMalaysia0.26%
37Malaking TubigPhilippines0.26%
38Panvel CreekIndia0.26%
39Tambo, PasayPhilippines0.26%
40Yangon RiverMyamnar0.26%
41Zhujiang/CantonChina0.26%
42Cagayan RiverPhilippines0.23%
43Chilyar RiverIndia0.23%
44Douala Estuary—0.23%
45Jalaur RiverPhilippines0.23%
46Periyar RiverIndia0.23%
47HamulauonPhilippines0.22%
48Mithi RiverIndia0.22%
49Rio OzamaDominican Republic0.22%
50Sungai KuantanMalaysia0.22%

Why this differs from the “10 rivers” you may have read about: studies from 2017 concluded that 10 to 20 large rivers carried most of the plastic. The 2021 model added rainfall, land use and distance to the sea for 31,818 river mouths, and found the load spread across many smaller urban rivers.

Source: Meijer et al. (2021) – processed by Our World in Data · CC BY 4.0.

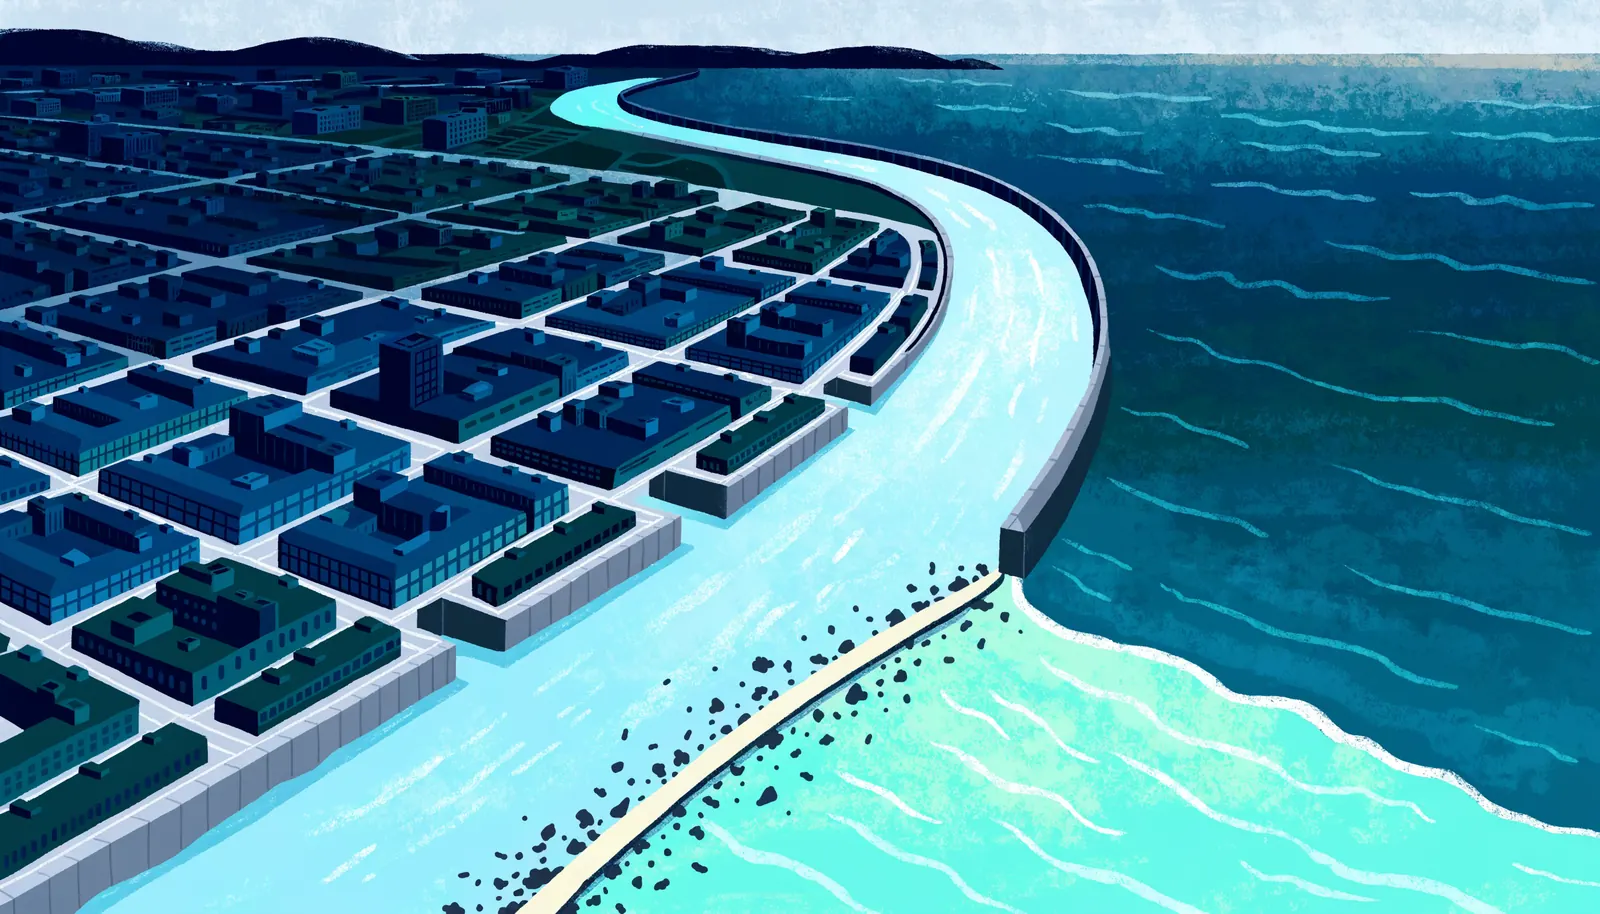
Illustration: a dense city grid beside a river that runs along a sea wall into the ocean, with scraps of trash gathering where it meets the sea

Illustration generated with AI

Small rivers, big cities: a short river through a dense city carries what the streets lose straight to the sea.An illustration, not a photograph of a real place. Made with Higgsfield (Recraft V4.1).
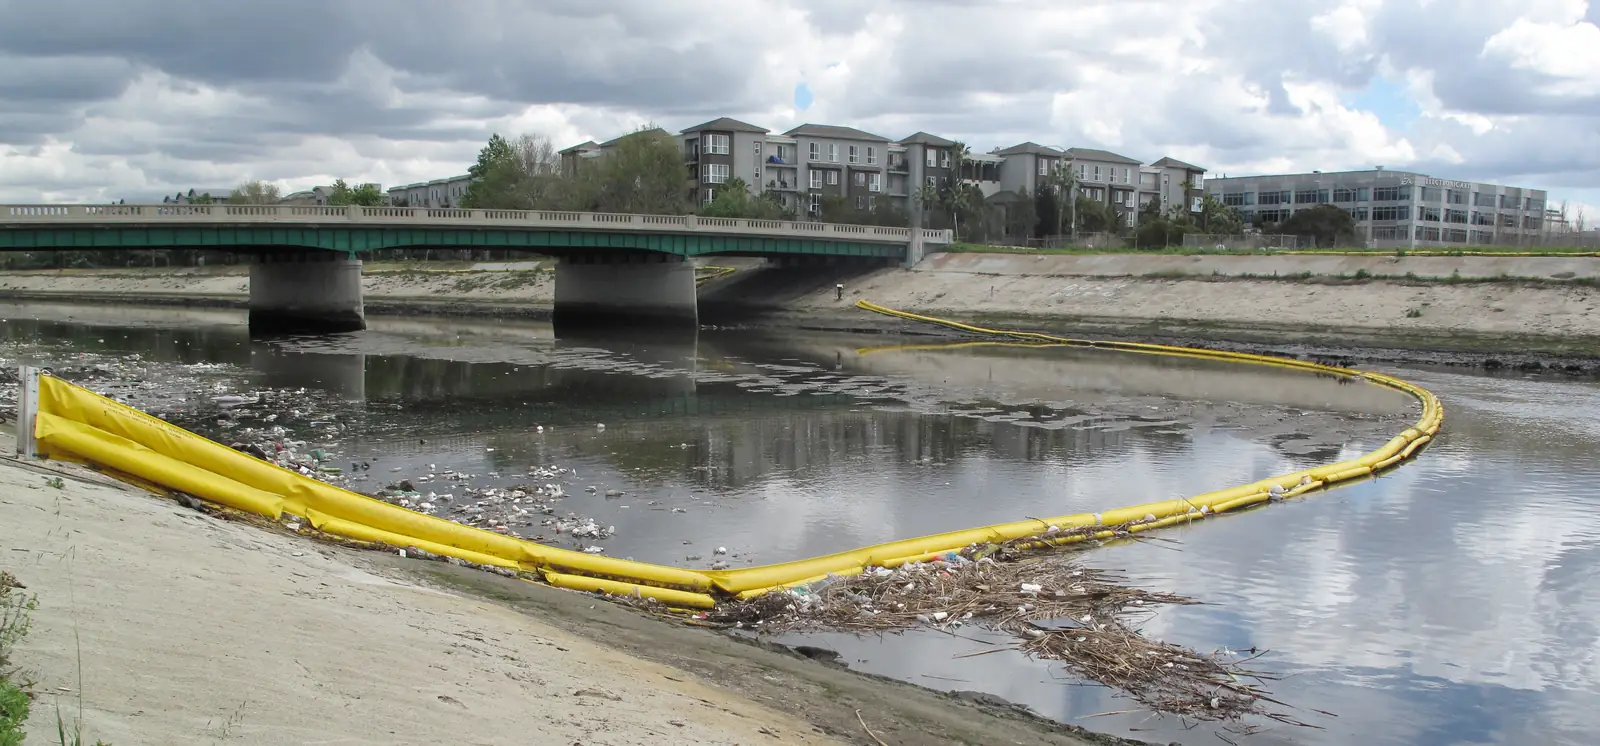
A yellow floating barrier curving across a concrete-lined creek, holding back floating trash under a bridge

04 · Cleaning it up

Catch it upstream.

Ballona Creek, Los Angeles33.97° N 118.43° WPhotographed March 2020. A floating barrier traps trash before it reaches the Pacific; trash collects behind it near the bank.Downtowngal, Wikimedia Commons (CC0)

Catching trash in a river is far easier than collecting it once it spreads across the ocean. These are the main ways it is done today.

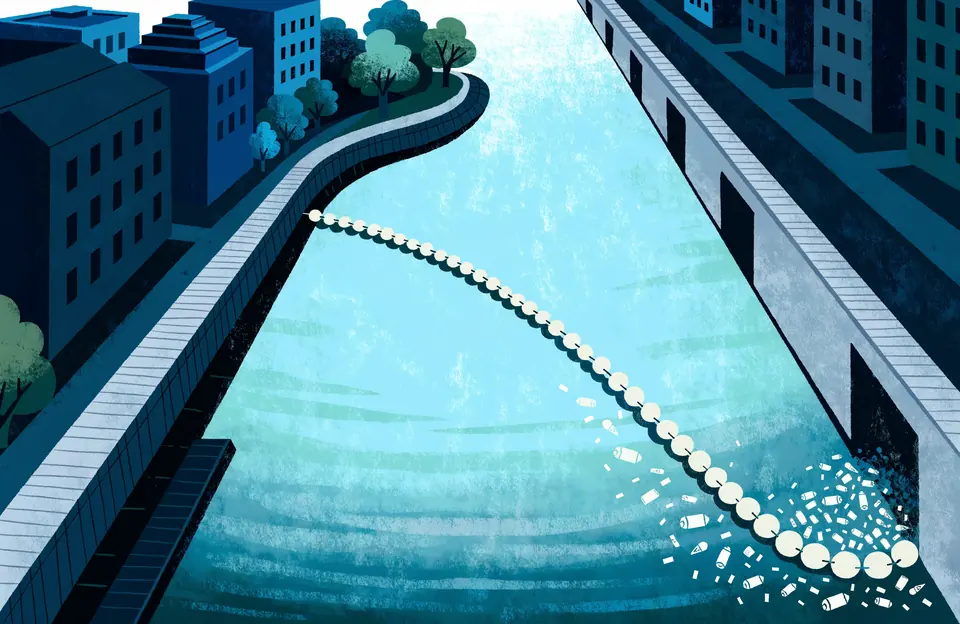
  • Illustration: a line of floats set at an angle across a city canal, guiding bottles and bags to one bank

    Illustration generated with AI

    01 / 05

    River barriers

    Floating booms set at an angle across a river guide floating trash to one bank, where it is lifted out.

    See one in Los Angeles ↑
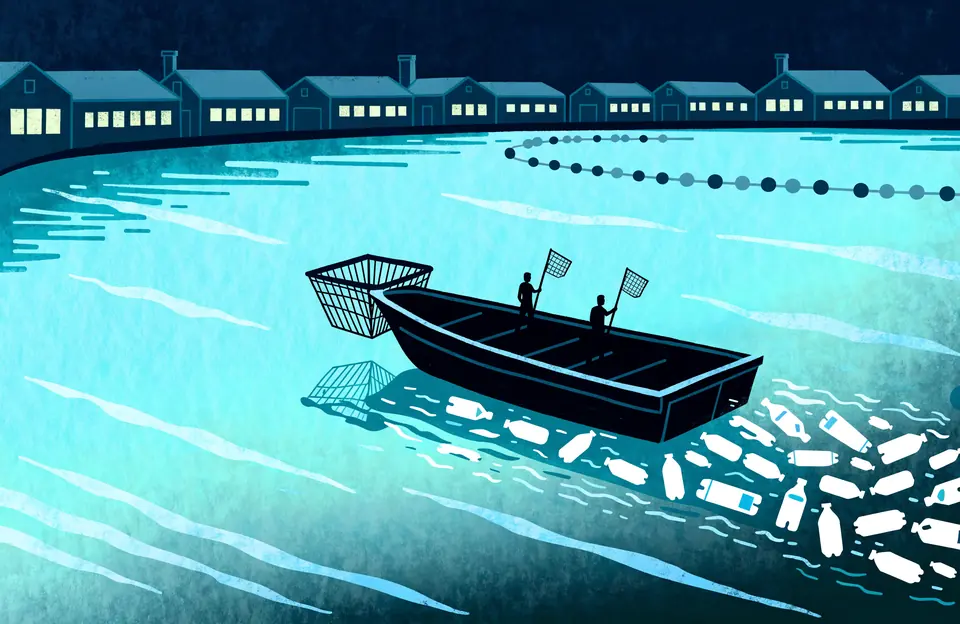
  • Illustration: a small boat with a wire basket on its bow in a harbor, two people aboard holding hand nets beside floating bottles

    Illustration generated with AI

    02 / 05

    Collection boats

    Small boats with a front net or basket skim floating trash from harbors and river mouths and bring it to shore.

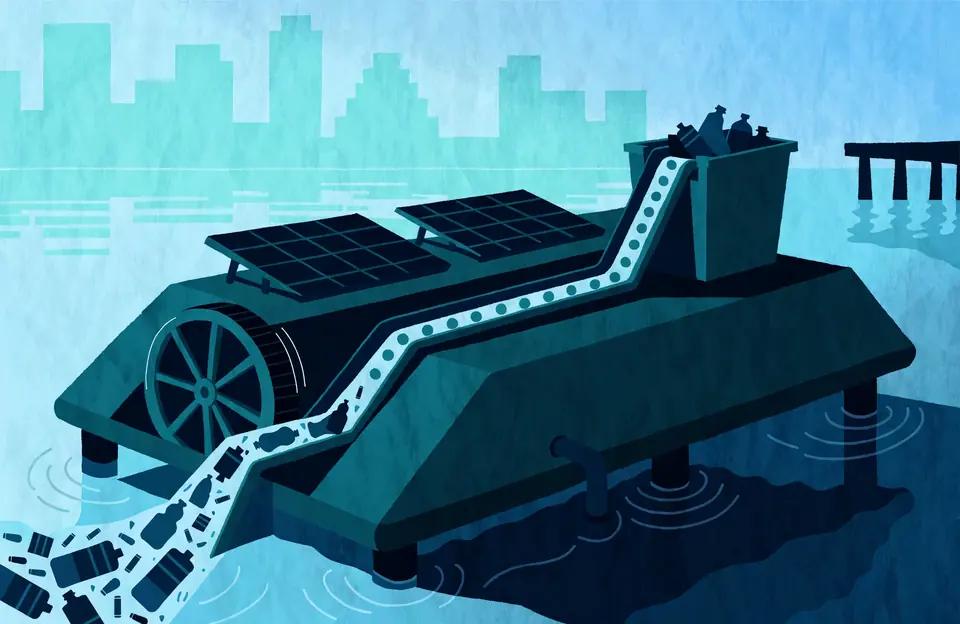
  • Illustration: a water-wheel collector with solar panels at a harbor edge, its conveyor carrying trash up into a dumpster

    Illustration generated with AI

    03 / 05

    Trash wheels

    In Baltimore’s harbor, water-wheel collectors powered by the current and the sun have pulled trash from streams since 2014.

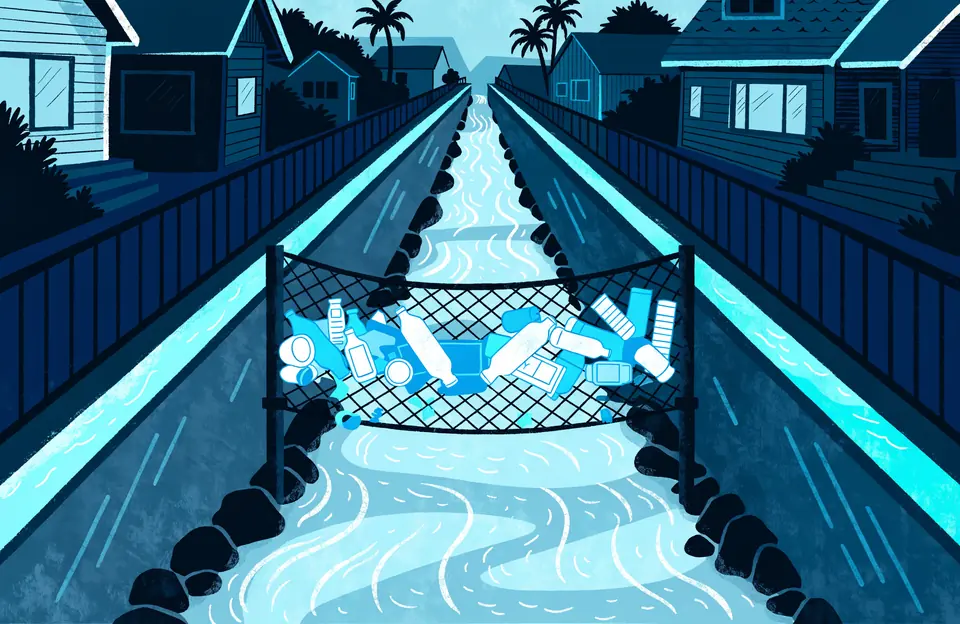
  • Illustration: a net stretched across a narrow concrete channel between houses, holding back bottles and bags

    Illustration generated with AI

    04 / 05

    Nets on small channels

    Fence-like barriers in storm gullies catch trash during heavy rain, before it reaches the harbor, as in Kingston, Jamaica.

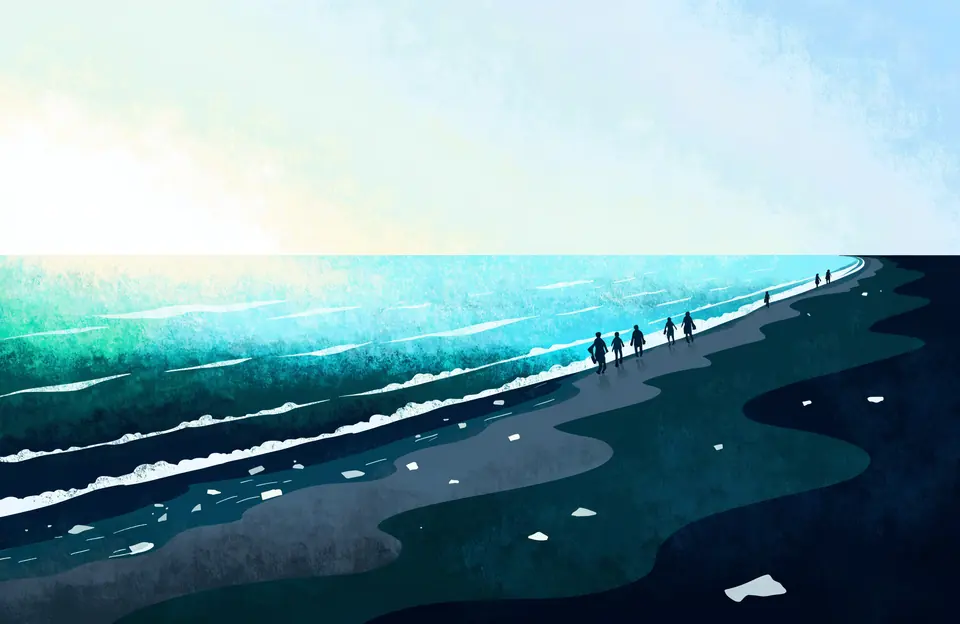
  • Illustration: a line of small figures walking a dark shore at low tide, with scraps of litter along the water’s edge

    Illustration generated with AI

    05 / 05

    Cleanups on the coast

    Volunteers and crews collect what has already washed ashore, and record what they find.

As of September 26, 2026, The Ocean Cleanup lists 26 river Interceptors in 12 countries on its public dashboard, including one on Ballona Creek in Los Angeles. The 2021 #TeamSeas campaign split its donations between Ocean Conservancy and The Ocean Cleanup. Tap Water Lookup is independent and not affiliated with or endorsed by these organizations.

The card pictures are illustrations generated with AI (Higgsfield, Recraft V4.1), not photographs of real places.

Illustration: water running from a kitchen tap into a clear glass on a counter

Illustration generated with AI

An illustration, not a photograph of a real place. Made with Higgsfield (Recraft V4.1).

05 · Closer to home

From the ocean back to your tap.

River plastic and the water from your tap are different stories. Check the public records for the water system that serves you; 97.6% of people in the United States use safely managed drinking water (2024).

Keep exploring

Every record tells
part of the story.

Find a place. Read the measurements.
Understand the context.

Explore water records